Understanding the charts:
Due to popular demand, we have added Palladium to the list of Analytical Charts that Metals Analyst Jim Wyckoff features.
Sharpening Your Trading Skills: Using Bollinger Bands
The Bollinger Bands (B-Bands) technical study was created by John Bollinger, the president of Bollinger Capital Management Inc., based in Manhattan Beach, California. Bollinger is well respected in the futures and equities industries.
Traders generally use B-Bands to determine overbought and oversold zones, to confirm divergences between prices and other technical indicators, and to project price targets. The wider the B-bands on a chart, the greater the market volatility; the narrower the bands, the less market volatility.
B-Bands are lines plotted on a chart at an interval around a moving average. They consist of a moving average and two standard deviations charted as one line above and one line below the moving average. The line above is two standard deviations added to the moving average. The line below is two standard deviations subtracted from the moving average.
Some traders use B-Bands in conjunction with another indicator, such as the Relative Strength Index (RSI). If the market price touches the upper B-band and the RSI does not confirm the upward move (i.e. there is divergence between the indicators), a sell signal is generated. If the indicator confirms the upward move, no sell signal is generated, and in fact, a buy signal may be indicated.
If the price touches the lower B-band and the RSI does not confirm the downward move, a buy signal is generated. If the indicator confirms the downward move, no buy signal is generated, and in fact, a sell signal may be indicated.
Another strategy uses the Bollinger Bands without another indicator. In this approach, a chart top occurring above the upper band followed by a top below the upper band generates a sell signal. Likewise, a chart bottom occurring below the lower band followed by a bottom above the lower band generates a buy signal.
B-Bands also help determine overbought and oversold markets. When prices move closer to the upper band, the market is becoming overbought, and as the prices move closer to the lower band, the market is becoming oversold.
Importantly, the market’s price momentum should also be taken into account. When a market enters an overbought or oversold area, it may become even more so before it reverses. You should always look for evidence of price weakening or strengthening before anticipating a market reversal.
Bollinger Bands can be applied to any type of chart, although this indicator works best with daily and weekly charts. When applied to a weekly chart, the Bands carry more significance for long-term market changes. John Bollinger says periods of less than 10 days do not work well for B-Bands. He says that the optimal period is 20 or 21 days.
Like most computer-generated technical indicators, I use B-Bands as mostly an indicator of overbought and oversold conditions, or for divergence--but not as a specific generator of buy and sell signals for my trading opportunities. It's just one more "secondary" trading tool, as opposed to my "primary" trading tools that include chart patterns and trend lines and fundamental analysis.
Sharpening Your Trading Skills: The MACD Indicator
The Moving Average Convergence Divergence (MACD) indicator has the past few years become one of the more popular computer-generated technical indicators.
The MACD, developed by Gerald Appel, is both a trend follower and a market momentum indicator (an oscillator). The MACD is the difference between a fast exponential moving average and a slow exponential moving average. An exponential moving average is a weighted moving average that usually assigns a greater weight to more recent price action.
The name “Moving Average Convergence Divergence” originated from the fact that the fast exponential moving average is continually converging toward or diverging away from the slow exponential moving average. A third, dotted exponential moving average of the MACD (the "trigger" or the signal line) is then plotted on top of the MACD.
Parameters:
Mov1: The time period for the first exponential moving average. The default value is usually 12, referring to 12 bars of whatever timeframe plotted on the chart. (This is the fast moving average.)
Mov2: The time period for the subtracted exponential moving average. The default value is usually 26, referring to 26 bars. (This is the slow moving average.)
Trigger: The period of 9 bars for the signal line representing an additional exponential moving average.
(Note: For a graphic example of the MACD indicator, send me an email at jim@jimwyckoff.com and I will email you back with the picture example.)
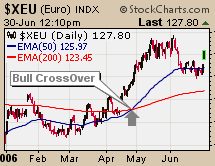
The MACD study can be interpreted like any other trend-following analysis: One line crossing another indicates either a buy or sell signal. When the MACD crosses above the signal line, an uptrend may be starting, suggesting a buy. Conversely, the crossing below the signal line may indicate a downtrend and a sell signal. The crossover signals are more reliable when applied to weekly charts, though this indicator may be applied to daily charts for short-term trading.
The MACD can signal overbought and oversold trends, if analyzed as an oscillator that fluctuates above and below a zero line. The market is oversold (buy signal) when both lines are below zero, and it is overbought (sell signal) when the two lines are above the zero line.
The MACD can also help identify divergences between the indicator and price activity, which may signal trend reversals or trend losing momentum. A bearish divergence occurs when the MACD is making new lows while prices fail to reach new lows. This can be an early signal of a downtrend losing momentum. A bullish divergence occurs when the MACD is making new highs while prices fail to reach new highs. Both of these signals are most serious when they occur at relatively overbought/oversold levels. Weekly charts are more reliable than daily for divergence analysis with the MACD indicator.
For more details on the MACD, Appel has a book in print, entitled: "The Moving Average Convergence-Divergence Trading Method."
As with most other computer-generated technical indicators, the MACD is a "secondary" indicator in my trading toolbox. It is not as important as my "primary" technical indicators, such as trend lines, chart gaps, chart patterns and fundamental analysis. I use the MACD to help me confirm signals that my primary indicators may be sending.
That's it for now. Next time, we'll examine another important topic on your road to increased trading success.
Sharpening Your Trading Skills: Moving Averages
I take a “toolbox” approach to analyzing and trading markets. The more technical and analytical tools I have in my trading toolbox at my disposal, the better my chances for success in trading. One of my favorite "secondary" trading tools is moving averages. First, let me give you an explanation of moving averages, and then I’ll tell you how I use them.
Moving averages are one of the most commonly used technical tools. In a simple moving average, the mathematical median of the underlying price is calculated over an observation period. Prices (usually closing prices) over this period are added and then divided by the total number of time periods. Every day of the observation period is given the same weighting in simple moving averages. Some moving averages give greater weight to more recent prices in the observation period. These are called exponential or weighted moving averages. In this educational feature, I’ll only discuss simple moving averages.
The length of time (the number of bars) calculated in a moving average is very important. Moving averages with shorter time periods normally fluctuate and are likely to give more trading signals. Slower moving averages use longer time periods and display a smoother moving average. The slower averages, however, may be too slow to enable you to establish a long or short position effectively.
Moving averages follow the trend while smoothing the price movement. The simple moving average is most commonly combined with other simple moving averages to indicate buy and sell signals. Some traders use three moving averages. Their lengths typically consist of short, intermediate, and long-term moving averages. A commonly used system in futures trading is 4-, 9-, and 18-period moving averages. Keep in mind a time interval may be ticks, minutes, days, weeks, or even months. Typically, moving averages are used in the shorter time periods, and not on the longer-term weekly and monthly bar charts.
The normal moving average “crossover” buy/sell signals are as follows: A buy signal is produced when the shorter-term average crosses from below to above the longer-term average. Conversely, a sell signal is issued when the shorter-term average crosses from above to below the longer-term average.
Another trading approach is to use closing prices with the moving averages. When the closing price is above the moving average, maintain a long position. If the closing price falls below the moving average, liquidate any long position and establish a short position.
Here is the important caveat about using moving averages when trading futures markets: They do not work well in choppy or non-trending markets. You can develop a severe case of whiplash using moving averages in choppy, sideways markets. Conversely, in trending markets, moving averages can work very well.
In futures markets, my favorite moving averages are the 9- and 18-day. I have also used the 4-, 9- and 18-day moving averages on occasion.
When looking at a daily bar chart, you can plot different moving averages (provided you have the proper charting software) and immediately see if they have worked well at providing buy and sell signals during the past few months of price history on the chart.
I said I like the 9-day and 18-day moving averages for futures markets. For individual stocks, I have used (and other successful veterans have told me they use) the 100-day moving average to determine if a stock is bullish or bearish. If the stock is above the 100-day moving average, it is bullish. If the stock is below the 100-day moving average, it is bearish. I also use the 100-day moving average to gauge the health of stock index futures markets.
One more bit of sage advice: A veteran market watcher told me the “commodity funds” (the big trading funds that many times seem to dominate futures market trading) follow the 40-day moving average very closely--especially in the grain futures. Thus, if you see a market that is getting ready to cross above or below the 40-day moving average, it just may be that the funds could become more active.
I said earlier that simple moving averages are a "secondary" tool in my trading toolbox. My primary (most important) tools are basic chart patterns, trend lines and fundamental analysis.
Sharpening Your Trading Skills: The Relative Strength Index (RSI)
One of the more popular computer-generated technical indicators is the Relative Strength Index (RSI) oscillator. (An oscillator, defined in market terms, is a technical study that attempts to measure market price momentum—such as a market being overbought or oversold.)
I’ll define and briefly discuss the RSI, and then I’ll tell you how I use it in my market analysis and trading decisions.
The Relative Strength Index (RSI ) is a J. Welles Wilder, Jr. trading tool. The main purpose of the study is to measure the market's strength or weakness. A high RSI, above 70, suggests an overbought or weakening bull market. Conversely, a low RSI, below 30, implies an oversold market or dying bear market. While you can use the RSI as an overbought and oversold indicator, it works best when a failure swing occurs between the RSI and market prices. For example, the market makes new highs after a bull market setback, but the RSI fails to exceed its previous highs.
Another use of the RSI is divergence. Market prices continue to move higher/lower while the RSI fails to move higher/lower during the same time period. Divergence may occur in a few trading intervals, but true divergence usually requires a lengthy time frame, perhaps as much as 20 to 60 trading intervals.
Selling when the RSI is above 70 or buying when the RSI is below 30 can be an expensive trading system. A move to those levels is a signal that market conditions are ripe for a market top or bottom. But it does not, in itself, indicate a top or a bottom. A failure swing or divergence accompanies the best trading signals.
The RSI exhibits chart formations as well. Common bar chart formations readily appear on the RSI study. They are trendlines, head and shoulders, and double tops and bottoms. In addition, the study can highlight support and resistance zones.
How I employ the RSI
As you just read above, some traders use these oscillators to generate buy and sell signals in markets-—and even as an overall trading system. However, I treat the RSI as just one trading tool in my trading toolbox. I use it in certain situations, but only as a “secondary” tool. I tend to use most computer-generated technical indicators as secondary tools when I am analyzing a market or considering a trade. My “primary” trading tools include chart patterns, fundamental analysis and trend lines.
Oscillators tend not to work well in markets that are in a strong trend. They can show a market at either an overbought or oversold reading, while the market continues to trend strongly. Another example of oscillators not working well is when a market trades into the upper boundary of a congestion area on the chart and then breaks out on the upside of the congestion area. At that point, it’s likely that an oscillator such as the RSI would show the market as being overbought and possibly generate a sell signal—when in fact, the market is just beginning to show its real upside power.
I do look at oscillators when a market has been in a decent trend for a period of time, but not an overly strong trend. I can pretty much tell by looking at a bar chart if a market is “extended” (overbought or oversold), but will employ the RSI to confirm my thinking. I also like to look at the oscillators when a market has been in a longer-term downtrend. If the readings are extreme-—say a reading of 10 or below on the RSI-—that is a good signal the market is well oversold and could be due for at least an upside correction. However, I still would not use an oscillator, under this circumstance, to enter a long-side trade in straight futures, as that would be trying to bottom-pick.
Oscillators are not perfect and are certainly not the “Holy Grail” that some traders continually seek. However, the RSI is a useful tool to employ under certain market conditions.
---------
Thank Jim and Kitco News. I backup here.


No comments:
Post a Comment