LISTENING TO: IKIMfm
IKIMfm
Pilihan Utama Anda

Live Online Trends

Wednesday, December 30, 2009

Fund managers tip Gold Investment as top for 2010

The Gold Investment rush of 2009 is likely to continue into the new year, according to the Association of Investment Companies (AIC).

Annabel Brodie-Smith, the organization's communications director, said that the ongoing economic recovery means that resources are expected to be the best performing sector over the next year.

"Interestingly this year's 'gold rush' is tipped to continue with over a quarter of managers predicting that gold will be the top-performing asset," she added.

Ms Brodie-Smith was commenting on a poll for AIC which revealed 28 percent of investment fund managers think gold will be top in 2010.

The study also found that five percent of fund managers think all asset classes will perform well over the year, while none backed bonds and residential property to perform best.

Gold has enjoyed a strong year in 2009, with prices hitting a high of $1226.10 an ounce in early December.

While prices have fallen back slightly, Barclays Capital precious metal analyst Suki Cooper told the Telegraph recently that Gold Investment should be viewed over the long term.

"It wouldn't surprise me if we had a little correction in the gold price but our position remains stay long," she told the newspaper. "In terms of technical trends the prospects for gold look strong."

Researching your first Gold Investment today? Don't pay more than you should! Make it cheap, simple & ultra-secure at BullionVault...
Goldbug, 30 Dec '09

Get Exposure to Rising Gold

The CPM consultancy's outlook for Gold Prices in 2010

WHAT'S THE OUTLOOK
for Gold Prices going into 2010...?

Here Carlos Sanchez, associate director of research at New York's CPM Group speaks to Hard Assets Investor...

HAI: You guys are very much involved in metals – gold, precious metals – and gold has been on a tear. We had one of your colleagues here several months ago, Jeff Christian, at the time when gold was probably more or less around $900 an ounce. He was not that bullish at the time, looking at fundamentals such as actual physical demand, mine output, etc. Yet we have broken through; we've seen gold vault up above the $1100 figure. How high do you think it could go?

Sanchez: Well back then, we didn't expect prices to perhaps rally as high as it did so quickly. We had expected prices to move higher, but over the course of later this year and into the first quarter of next year.

Gold Investment demand has been the main driver behind prices over the past couple of years, and more so over the past several months. I think investors continue to be concerned over financial markets, economic conditions and political conditions as well. So I think with weak economic growth, with high unemployment, with what's going on in Afghanistan, Iran, etc., you have increased concern. And investors continue to rush to safe-haven assets such as gold.

HAI: Are investors coming up with new bullish-for-gold arguments, and bearish on the general economy, even though we're starting to see things improve?

Sanchez: Even despite the recent stabilization and the pickup in stock markets over the past several months, I think there's concern that stock markets remain vulnerable, not only in the US, but around the world. You also have increased concern over the economic conditions. There have been signs of stabilization, but they still remain vulnerable. Economic growth has not been as it was over the past several years

HAI: What about some of these extreme forecasts? I've heard people say, "We're going to $5,000. We're going to $10,000...$20,000..." Are those realistic?

Sanchez: I don't think they're realistic now. I think we'll have to wait to see what happens over the next several months. But I think $1,400, $1,500 is definitely a possibility, perhaps early next year. As far as $2,200, I think economic conditions will probably have to deteriorate from here going forward for us to see that price level.

HAI: Now if they don't deteriorate, if we continue to see the stock market improve and maybe even start to see some job creation at some point...don't forget, back in 2003, I remember very well the so-called jobless recovery turned into a recovery that actually created jobs. Can we have a scenario where gold continues to appreciate even though real economic conditions improve?

Sanchez: You know, if economic conditions do improve and you see a steady decline in unemployment, a stabilization in economic conditions and financial markets, you may see Gold Price gains capped. But at the same time, they will be supported. Because it will take several years for unemployment to move back to levels where it was prior to this recent financial calamity.

HAI: So from your perspective, there's no element of excess speculation or sort of a bubble environment right now when we talk about gold?

Sanchez: I think investors have helped push prices higher. They've been chasing prices higher, and that's helped sort of continue that cycle of rising prices. Perhaps once investors see that their price targets have been hit, there will be a pullback in prices. But at the same time, that pullback may not be as sharp as some expect. I think the pullback, as we've seen over the past several months, has been $30 to $40. But at the same time, the investors have been willing to Buy Gold at increasingly higher levels.

HAI: All right. So just quickly, would you say the new floor, what price level is that? $700, $800?

Sanchez:
On a short-term basis, I think that price level is $1,100. If prices do fall below that, I think you could see increased buying. There's potential for prices to fall perhaps $40 to $50 lower. But that would, I think, pick up investor attitudes, and there could be some increased buying there. But next year the floor may be $1,000 if not $900.

Wednesday, December 23, 2009

Gold Trends, Hot Commodities and the Major Indexes, Trade the Trend!

Monday, December 21st, 2009

December 20, 2009
Gold Trends:
Gold has been leading the market for almost a year. Last week gold and gold stocks were trading at support looking ready to bottom but as you will see in my charts below, both broke support on heavy volume.

With gold now under performing the stocks market, I get the feeling we could see the broad market top. Topping is a process and after this strong climb I figure it will be choppy (tough to trade). Much like the price action on the Dow and S&P500 the past month, but this time it will be on a larger scale.

From a technical stand point the major indexes are trading at a key resistance zone from Oct 2008. This has been an amazing year for trading but I think the time has come for a correction or another melt down depending on how you view the US economy. It does not really matter which happens as we can play both directions.

As far as the fundamentals go, well the US economy in my opinion is scary. All I know is that if the markets start to melt down everyone better make BIG money on the way down because a severe correction will cripple the county as millions more will become unemployed. I am concerned that current recession may turn into a depression.

‘If’ we get another stock market meltdown, literally every asset class will go down with it. The only difference I think will be the trend of gold. Everyone has started to buy gold or at least thought about buying some.

‘If’ a meltdown occurs I think gold will go down in price at first with everything else, but if we are headed for another market collapse EVERYONE will turn to gold as the safe haven, triggering a massive parabolic spike straight up which could last years.

Enough of this negative talk, Lets take a look at the short term gold trends.

Gold Trend – Daily & 60 Minute Chart

The trend of gold broke down from the red rising channel a couple weeks back as expected. We were taking profits at the $115 level.

The more recent price action shows two technical breakdowns on the daily chart and the small 60 minute overlaid chart. The daily breakdown crashed through our support trend line and the 60 minute chart shows the breakdown below the previous low. The price is currently trading at resistance and the odds now favor lower prices.

Gold Trends

Gold Trends

Silver Trend – Daily Chart

Silver is trading at support and has yet to break the previous low. I think we will see this happen in the next few days.

Trade Trends

Trade Trends

Crude Oil Trend – Daily Chart

Oil had a great setup last week with many readers profiting from the oversold bounce off support which I pointed out on the daily chart last week. When buying into an oversold setup like this I scale in over 2-3 days in case prices dip lower as the selling dissipates. Average price was $35.75 and sold at first target of $37 for a 3.5% profit. Many of us still hold a core position with a tight stop.

The 60 minute chart shows this play and how the price popped once the sellers were cleared out.

Trading Trends

Trading Trends

Natural Gas Trading Trend – Daily Chart

Trend lines provide excellent levels for support and resistance and this chart is a perfect example of that. Not much to say about this chart other than UNG is trading at resistance and volume is big. This tells me we could see lower prices from here or some sideways price action first.

Natural Gas Trends

Natural Gas Trends

Broad Market Index – Dow Jones ETF – Daily Chart

In short, the market is starting to correct as we thought. It still has more to go before testing support. But because this week is a holiday week, volume will be light and like volume favors higher prices. So we could see the highs tested or sideways action.

From looking at the monthly, weekly and daily charts of the major indices I think the market is about to have a sharp correction. If we get a breakdown then we are headed to the next support level which is about 9% down from the recent high in the DIA etf fund.

Major Index trends

Major Index trends

Gold Trend and Technical Conclusion:

The trend of gold has been very predictable over the recent months and this correction seems to be text book pullback. I see the short term trend of gold still down but the longer and more powerful underlying trend is up. Let’s wait for the price of gold and silver to sort itself out and wait for low risk entry points before jumping back in.

Crude oil is in pinball mode. It’s just bouncing around between support and resistance levels now. Not much we can do but wait for another setup.

Natural gas is trading at resistance and if we get the proper price action in the next few days we could have a great short trade. Only time will tell.

The broad market trend is looking and feeling very toppy. A lot of money has been moving out of stocks the past 4 weeks and January could be a roller coaster. Last week I exited all my positions except XTR.TO (Energy and Financial dividend fund) which many of us took a position in late February and first week of March. I have set a tight stop and hoping to get the 4th dividend payout before it corrects.

I want to note that I am not going to be shorting the market until the bear trend is definitive. This could be 2-3 months down the road still. But after a great year of trading and the market and economy looking the way it does I am happy to be sitting in cash.

Tuesday, December 8, 2009

Tis the Season to Trade the Seasonal Charts, Dow, Gold, Silver, Oil and Gas

Dec 2nd, 2009
The market has had a fantastic week so far for stocks and precious metals. The financial and energy sector are underperforming which is a concern, but we continue to hold our positions and will wait until a reversal to lock in our gains.

Things seem to be lining up for stocks and precious metals to take a breather, which is in line with the Dow Jones Seasonal chart below.

Let’s take a look…

Dow Jones ETF
You can see from looking at the chart the repeated pattern of price rallies, leading to exhaustion and a test of support, followed by another repeat of the pattern. It looks as if the broad market is setup for a test of support which could happen within 2-4 days. Then as we near the holiday prices will start to drift higher. This pattern occurs more often than not as seen on the Dow Jones Seasonal chart below.

Broad Market Holiday Rally

Broad Market Holiday Rally

Dow Jones Seasonal Trends
This chart clearly shows weakness in the first half of December and continued strength moving forward. This has not really happened in the past two years which means we are overdue for continued strength. 

That being said, the previous two years were bear markets and we are now in a bull market. So the tendency is for buying to continue into year end.

Dow Jones Seasonal Trends

Dow Jones Seasonal Trends

GLD ETF Fund
Gold continues to push higher surprising many of us. It seems as though money is rushing into metals and buyers are not particularly concern about price. While this is great for short term traders and those of us in the trade, we must remember that the faster things go up, the quicker they correct.

Don’t get me wrong, I don’t think gold is going to crash, I just think we could get a 10% correction before moving much higher. Gold is also trading near the upper end of the trend channel and could have a 2-4 day consolidation with the broad market before pushing much higher.

GLD ETF Trading

GLD ETF Trading

SLV Exchange Traded Fund
Silver has been underperforming yellow gold but is still a solid investment. It is also trading near the upper end of the trend channel and could have a 2-4 day consolidation with the broad market.

Silver ETF Trade

Silver ETF Trade

USO & UNG Funds
Oil continues to flag from its breakout back in October. This is a bullish pattern. Last Friday we saw oil open much lower then rally back into the trend channel. This is called an outside day and many times this happens to stocks and commodities as it shakes out the weak traders before starting another rally higher. We will keep a close eye for any low risk entry point.

Natural Gas had a nice rally last week which I mentioned looks a lot like a short covering rally. The price action this week suggests it was and has now made a new low. Today on CNBC it was reported that a new source of natural gas has been discovered. This resource is 20 times larger than the biggest source in the US. Enough gas to last the US over 100 years. This added to the selling on both natural gas and oil today.

Energy ETF Newsletter

Energy ETF Newsletter

Trading Conclusion:
Precious metals continue to perform well and it’s important to note that PM stocks are now moving higher with gold. They have been lagging for some time but are on fire again. Great to see!

The Dow Jones index and several others look ready for a breather. The timing of these overbought charts bodes well for the seasonal December pause before the holiday rally. Time will tell.

Energy and financials are both underperforming the market and without their participation we will not see the indexes move much higher.

Continue to hold precious metals positions but be ready to lock in profits if we see the market reverse sharply. I am watching energy for a play but no setups at this time.

Gold: Technical correction before the final frontier

This post is a guest contribution by Dian Chu*, market analyst, trader and author of the Economic Forecasts and Opinions blog.

Gold fell for the first time during last week, off 4% on Friday to $1,162.40 an ounce, the biggest drop since Dec. 1, 2008 after the new U.S. jobs data showed unexpected strength. The Dollar rallied against rival currencies while traders reversed the “Sell Dollar/Buy Gold” strategy. (Fig. 1)

The Dollar’s decline has been a key factor in the record rising gold price this year by boosting the metal’s appeal as an alternative investment along with other commodities and high-yielding currencies.

Though gold briefly touched a low of $1,136.80 during the Thanksgiving week on fears of a possible debt default in Dubai, the precious metal had otherwise continued its vertical ascend into uncharted territory advancing in 21 of the past 23 sessions.

dian1


While gold has some underlying support from central banks and investment funds, there are some indications suggesting gold is moving mostly on momentum, and that a deeper correction may be due.

India Leading the Gold Rush

Gold’s rally in the past couple weeks was largely on speculation that India’s central bank may buy more gold from the IMF adding to the 200 ton purchase it made last month.

This second purchase by India would be the fourth central bank sale this quarter of IMF bullion. The three prior sales were Sri Lanka’s $375 million purchase of 10 metric tons; India’s initial $6.7 billion purchase 200 metric tons, and Mauritius bought 2 tons for $71.7 million.

The three sales so far leave about 190 tons up for grabs from the 403.3 tons the IMF announced Sept. 18 it would divest to shore up its finances.

China, The New King of Gold

Private Chinese gold buying, for both jewelry and investment, will overtake Indian demand this year, predicts metals consultancy Gold Fields Mineral Services (GFMS). China is now the world’s No.1 gold mining nation. The People’s Bank is widely thought to have grown its gold reserves by buying domestic production direct.

In addition, China has cut the import tax on jewelry and allowed select commercial banks to sell gold bars, and gold is now traded freely on the Shanghai Gold Exchange.

Russia & Vietnam Not Far Behind

On Nov. 23, Russia’s central bank announced it had bought 15.6 metric tons of gold in October and has said it aims to increase gold’s share in its reserves this year to keep its investments diverse. The Russian central bank had been steadily building its gold stocks this year, which has been up 17% since Jan. 1 to 606.5 tons.

The Vietnamese central bank has also granted quotas to import 10 tons of gold for use by its banking system and gold traders.

Low Interest Rate with Worthless Paper

Some analysts attribute the most recent rally to the reversal of a decades-long selling of gold by developed economy central banks to net buying by emerging market authorities.

Gold accounts for 9% of reserves held by central banks (valued at market prices). Therefore, it is logical for central banks stocking up on gold as it does bring the much needed diversity due to gold’s low correlation with key currencies and its strong inverse correlation with the US Dollar.

However, diversifying reserves primarily via gold rather than other currencies partly suggests the expectation of interest rates around the world to stay low for a long time. Moreover, it reflects central bankers’ growing distrust of all paper currencies, not just the Dollar.

Surging Derivative Trading

Some of the world’s most successful traders, including John Paulson, David Einhorn, and Paul Tudor Jones, have positions in gold or gold related investments. Pension funds allocate about 5% as protection against the weakening Dollar. Hedge funds and traders are piling into gold futures markets around the world, lured by the record-high prices in the precious metal.

Based on the Commitment of Trader (COT) report as of November 24 by the U.S. Commodity Futures Trading Commission (CFTC), the number of long positions in gold was around 370,000, up about 5,000 from just a week ago, mostly from non-commercial short-term speculative investors.

dian2
It is also interesting to note CFTC Nov. 2009 monthly report shows that while commercial participants held net short positions; non-commercial and other participants, who accounted for 51.4% of open interest, held net long positions,. Some traders already indicated there has been some good upside buying in March and April in the $1,300s and even $1,400s.

Overall, NYMEX Gold futures open interest increased 4.8% in November with longs outnumbering the shorts by 71% to 12%. This would have been the highest number of long speculators in the history of the New York gold market since 1975, except for last year when the gold hit $1,030. (Fig. 2)

High number of speculative positions is the driving force of the commodities rally in general, but that also makes gold vulnerable to further corrections as well as high volatility.

Diminishing Physical Demand

Regardless of the gold fever this year, according to the third quarter 2009 Gold Demand Trends Report from the World Gold Council, demand reached 800.3 tons, representing a drop of 34% year-over-year. The report also found that average gold prices for the quarter were 10% higher than in the same quarter last year.

Diminishing physical demand coupled with higher price suggests it has been mostly speculators that are driving up the price. In addition to central banks using gold to rid Dollar dependency, fund managers and speculators also have been driving up the price of gold, partly seeking protection from potential inflation in a low interest rate environment.

Fear Factor

Gold is a commodity that perception plays a more significant role than other market factors. Almost all other commodities such as crude oil, natural gas, copper, prices often fluctuate on indications of inventory, supply, and demand; whereas gold moves primarily with investor’s fear or perception of inflation, U.S. Dollar and the economy.

But just as fast as the market perception can drive prices straight up, it could tank an asset class in a matter of minutes. As discussed here, investment/speculator demand is clearly a major factor in the current gold price rally, a decline could potentially take the gold price down quite significantly on indications such as rising interest rate, or the U. S. Dollar starts to strengthen.

If history is any indication, after gold rose sharply in 1979-1980 to $850, it was followed by a drop to near $500 in less than 2 months. It is conceivable that gold could take a similar loss in a short time.

Short-term Outlook

The general expectation is that the Federal Reserve will not act in favor of the Dollar until later next year. Gold and Dollar correlation is still highly negative, but one should expect a fair amount of volatility given the uncertainty of global economic direction intensified by the Dubai crisis. In that sense, gold could certainly challenge the $1,225 levels again, with $1080, $1050 and $1025 each represents significant support level.

Technically Overbought

Friday’s pullback has moved gold’s MACD to the downside and the 14-day Relative Strength Index (RSI) back in the neutral territory (Fig. 1), which could spur more selling if Dollar retains its strength.

Though gold’s longest rally (nine days) since 1982 ended last Wednesday, the precious metal is racking up a near 35% gain on the year, and moved up almost 17% this month alone, heading for the sharpest annual increase in two decades.

So, at this level, gold has also run into profit-taking, as well as year-end fund manager’s portfolio repositioning. Closes below the 20-day moving average crossing would likely confirm that a short-term top has been posted.

Long Term Bullish Intact

Sporadic green shoots of economic data could obscure the harsh reality, and lead to gold weakness in the short term. Nevertheless, there’s enough momentum around for gold to make new highs as long as the Dollar stays weak spurring further safe haven demand on concerns about a double dip recession.

Therefore, the potential exists for a large rise in the longer term. However, if this rally extends into uncharted water on momentum without a healthy enough correction, upside targets will be hard to project with the eventual correction equally difficult to predict, just as they say, “The higher you climb, the harder you fall.”

*Dian Chu, Market analyst, trader and financial writer for Seeking Alpha, Zero Hedge, Daily Marksts, iStockAnalyst & StraightStocks. My articles also appear in Reuters, USA Today and BusinessWeek, etc. Professional credentials include M.B.A., C.P.M. and Chartered Economist with extensive professional experience in market segment forecasting and strategies. Previous employers include Enron, Time Warner & Clear Channel. I’m currently working in the U.S. for the energy sector.

Source: Dian Chu, Economic Forecasts and Opinions, December 6, 2009.

--------------------------------------

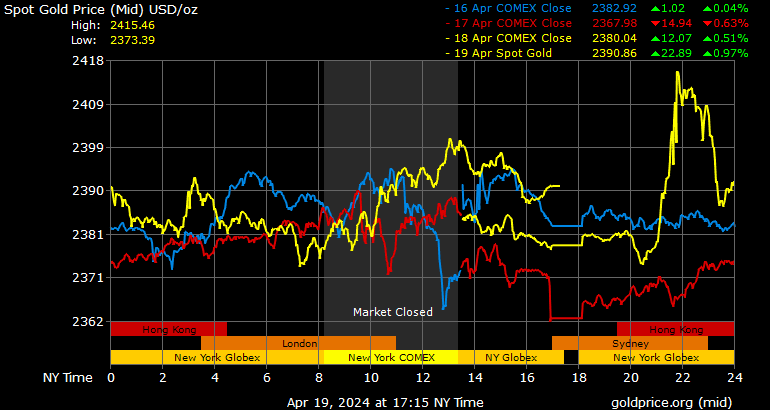
Paksu : Be cool with this situation, the overbought gold will return in bull pipe with 2-4 days.
GLD ETF Trading

Saturday, December 5, 2009

Emas catat harga rekod tertinggi - Kosmo 3 Dis. 2009


GAMBAR fail menunjukkan jongkong emas di sebuah bank di Switzerland baru-baru ini.


LONDON - Harga emas mencapai paras rekod melepasi AS$1,217 untuk setiap auns (31.1035 gram) atau RM132 segram semalam berikutan kebimbangan pelabur yang mencari tempat selamat setelah nilai dolar semakin lemah.

Harga emas di Pasaran Bulion London melepasi paras halangan AS$1,200 (AS$1=RM3.38) buat kali pertama kelmarin.

Selepas mencapai harga rekod baru, emas jatuh sedikit untuk didagangkan pada harga AS$1,207.82 menjelang tengah hari. - AFP

Monday, November 30, 2009

The Dow, Dollar & Gold – What Goes Down Must Come Up

Sunday, November 29th, 2009

This year has been a very exiting time for traders and investors. We have seen a steady climb in prices with controlled pullbacks in the broad market and gold.

Using technical analysis we are able to quickly and accurately make informed decisions just from looking at the charts. In the charts below you will see how simple chart patterns along with support & resistance levels can provide excellent low risk entry points. Also you will see how candle stick charts can be an early indicator for prices to reverse direction.

DIA ETF – Daily
The DIA (Dow Jones Index Fund) is trending higher. By applying some basic technical analysis you are able to time your entry points having the odds in your favor.

In this chart I use two simple forms of analysis. The broadening formation (red trend lines), and horizontal support zones shown in blue.

Broadening Formations: This is when the price becomes more volatile making higher highs and lower lows. I think of it as one of those Megaphones for talking to large groups of people. So when a chart has this pattern it’s virtually yelling at me and I start taking profits or tightening my stops.

Horizontal Support Zones:
I like to focus on support or resistance zones which are a little different than most traders. I do not use the top and bottoms of previous waves for these levels. Instead I take the average price then expect the support level to be penetrated somewhat as the level is tested. This is how the market keeps you out of the good trades. I cover this in great detail in my Stock Market Trading Education Course available in January.

Analysis:
The DIA ETF looks ready for a pullback to the $99- 100 level.

DIA ETF

DIA ETF

GLD Exchange Traded Fund – Weekly
Gold has been on fire and riding this wave up has been very profitable thus far. Last week a doji candle was formed on the chart and this can signal a change in short term price action.

This chart shows some of the past doji candles and what happened to the price of gold soon after. What this candle is telling us is that the buying and selling pressure is equal. So we know momentum is slowing and we should expect a consolidation or correction.

Because gold has rocketed higher, indeed going almost straight up in the recent weeks, I expect a pullback to be very quick. A drop to the $110 or even the $100 level in the coming weeks is not out of the question, but we all know commodities can go parabolic for several months (straight up). This is why we continue to tighten our stops and keep holding out long positions.

Gold Exchange Traded Fund

Gold Exchange Traded Fund

US Dollar – Weekly
The US dollar has been up and down like a yo-yo in the past 15 months. The chart below clearly shows what has been happening with this currency and what I think we could see very soon.

The blue support zone (73-74) is a key pivot point for the dollar. That being said lets take a look at the chart.

During the time when the price is trending higher July 2008 – Feb 2009 we see lower wicks appear more often. This tells me that sellers pushed the price down early in the week but were then overcome by buyers nearer the end of the week. This is bullish price action. Also the broadening patterns during this timeframe’s tops indicate increased volatility and we know that is a sign of weakness.

From March 2009 – Sept 2009 the trend was down and there are longer upper wicks telling us buyers became over powered by sellers each time the price rallied.

In the recent 3 months we observe lower wicks meaning buyers are moving into the US dollar again. Knowing that there is major support below the current price I have to think the dollar could start to bottom around this level.

US Dollar Trading

US Dollar Trading

Trading Conclusion:
The broad market is becoming unstable and looks like it could have more of a pullback this week. I would not be adding to any long positions until we see the market trading near support. Three out of four stocks move with the market so it is crucial to understand the overall market direction when buying and selling stocks and commodities.

Gold is trading at a level which is fuzzy. The weekly chart is neutral and the daily chart is still on fire as it moves up. All we can do is ride our positions and keep raising our stop prices.

The US dollar could start to bottom over the next few weeks. Depending what happens with Dubai this week we could be in for a big bounce in the dollar as investors flock to safety as the US dollar is still the currency of choice if/when other countries start to have a financial melt down again.

Paksu : For the time being, gold will run inverse the USD. Last Saturday, USD make some correction up and Gold was down little bit... any other comments

Gold, Silver and Oil Out Perform their Equities?

Sunday, November 22nd, 2009

Since the market crash in late 2008 we have seen investors favor quality stocks that pay dividends and have steady earnings. Fast growth companies and equities with physical resources like commodities have also done well.

Let’s examine the monthly charts of gold, silver, oil and natural gas – and observe how they have traded in comparison to their mining equities

Gold – Monthly Chart
Looking at the monthly chart as far back as 2004, we see that gold has formed the same patterns repeatedly. This has created a stair step pattern and allows us to calculate measured moves and a time frame for this to take place.

As we can see gold has broken its 2008 high and is starting another rally which we have seen several times before. I figure we could see gold rally for another 3-5 months and possibly reach the $1500 -$1600 level before forming a multi month or year consolidation.

Investors around the world are buying gold because it is a physical product which has been proven to hold its value.

Gold Newsletter
Gold Monthly Trend

Silver & Precious Metal Stocks – Monthly Chart
Silver and PM stocks have been trading in tandem since 2004 and we can see this by looking at a price performance chart of both silver and the HUI index. The interesting part is that the physical commodity silver has held its value better than the stocks during corrections.
Apparently investors prefer tangible investments over stock certificates of mining companies in periods of increased volitility. Lower risk is in the commodity.


Silver Newsletter
Silver Monthly Trend

Commodity Trading Conclusion:
Investors around the world continue to put money into gold which is a universal hedge against inflation. The broad market appears to be trading at a major resistance level. Tops in the market generally take a much longer than to reverse directions than market bottoms. We will not knot for sure if we are entering a top for a couple months as the charts unfold. Now that commodities are trading back at reasonable levels I think they will hold up better than equities if the market starts to correct.

We continue to enter low risk setups and trade with this strong up trend but are aware that we must be protected and focus on the lower risk plays.

Saturday, October 10, 2009

Oil, Gas, Silver Gold – Getting Ready for Next Rally

Commodities have and continue to be a fantastic trading vehicle for those who can stomach volatility. After last year’s market crash most commodities pulled back to normal if not lower than normal trading ranges. This allowed us to enter the market at 10+ year lows for natural gas.

If we look at the weekly chart for gold, silver, oil, natural gas and the CRB commodity index we can see that commodities in general look ready to skyrocket higher approximately 34% on average in the next 4-12 months.

Take a looks at this chart of gold. While this chart shows the basic technical analysis of the price of gold you can see the completion of the Cup & Handle pattern which is VERY BULLISH. Also you can see gold broke to a new high. While I don’t like to trade new highs it’s hard not to want to buy into this breakout. Most traders should be long gold already, but if you are not, you have a couple of options. Buy into this breakout with a tight stop or wait for a pullback and buy on a test of the breakout. Personally I am waiting for a pullback (test of breakout) before I add more to my position.

Trade Spot Gold

Trade Spot Gold

Silver has been strong but has not held up its value as well as its big sister (gold). As you can see silver must break through two more major resistance levels before making a new multi year high. Overall silver still looks strong and I will be waiting for a low risk setup for us to add more to our positions.

Trade Spot Silver

Trade Spot Silver

Commodity Trading Conclusion:
Overall commodities look like a great buy. We are seeing precious metals moving up strongly and gold making a new high which is very exciting as our golden rock stock plays push higher and our commodity ETF play continue higher as well.

Chris Vermeulen

Sunday, September 27, 2009

The Reason Why Gold Hasn't Skyrocketed


With the printing presses in full printing mode, many people are questioning why gold prices haven't gone higher - much higher.

In my new video, I explain some of the subtle market cycles that are at play right now in this market. These short-term cycles have been the dominant force in gold all year and appear to be still in control of price action.

I believe the longer-term upward trend in gold is very much intact; short-term we could see more of a trading range that has a downward bias. I think when you watch this video you will get a much better understanding about the rhythm of this market.

If I am correct, you will see some amazing opportunities that I believe will be presented to traders in Q4. In fact, if everything goes according to plan are we could all be looking at some very nice Christmas/holiday profits.

The video is easy to follow and I think you'll learn a whole lot about cyclic price action in the gold market.

We do not require you to register to view this video.

Discover and benefit today from what I learned over 30 years ago in the trading pits of Chicago.

Enjoy the video and please give us your feedback on this blog.

Every success,

Adam Hewison
President, INO.com
Co-creator, MarketClub

Monday, September 7, 2009

Gold & Silver Technical Trading Charts

I hope everyone enjoyed the weekend!

Gold is once again the hot commodity, as the price rises to the $1000 per ounce level. This $1000 – $1033 is a technical pivot point for gold. One of two things is going to take place in the coming weeks.

If the price of gold can move above $1033 then I expect to see a lot of traders and investors buying gold, as they panic into the position because they do not want to miss another gold rally. Also traders who are short gold will be forced to cover their positions and this will send the price of gold rocketing higher towards the $1200- $1500 area. On the other hand, if gold fails to break higher, we will see a swift sell off, as everyone sells their position.

HUI – Gold Stocks Index – MonthlyI like to use this chart for timing longer-term gold investments. Gold stocks tend to lead the price of gold on a percentage gain/loss basis and so far this month, gold stocks are on fire. This bodes well for gold.

When I see breakouts on this monthly chart, I tend to take larger positions in gold and gold stocks because rallies tend to last 2-6 months. I like to take profits, as the price rises, so that I am locking in gains while still taking part in the continuing move.

The gold stocks (Golden Rockets) we purchased 2 months ago are now up 45% and 100% from our entry point and they still look very strong. Taking some money off the table is a great idea. Gold could go either way fast and it’s better to sell some of the position to lock in profits and let the balance of the trade run. Too many traders swing for a home run and never take profits on winning positions. Winners eventually turn into losers if you hold on to them long enough. Money management is the key to successful trades.


Price of Gold – Gold Bullion – Weekly ChartThis chart clearly shows the breakout last week from the pennant pattern. The price of gold is nearing resistance. This week will be exciting as gold tries to breakout.
Add Image


Price of Silver – Silver Bullion – Weekly ChartSilver is not as close to the 2008 high like gold is, but is still performing well. Silver is trading at a short-term resistance level and I expect to see higher prices this week.

Silver and Gold Newsletter Conclusion:Gold and silver are starting to run higher and with all the media coverage I expect to see money moving into precious metals for a couple months. This is an exciting time for precious metal investors and a lot of money is going to be changing hands once these metals pick a direction and start moving.


Chris Vermeulen thegoldandoilguy.com

Gold Investment being driven by economic fears, says analyst - 05/09/2009

The editor of a well-respected precious metals newsletter claimed yesterday (September 3rd) that investors are rushing to Buy Gold for its safe-haven status.

James di Georgia, who produces Gold and Energy Advisor, is an experienced gold analyst whose views are often quoted in leading publications such as the New York Times and USA Today.

He explained in an interview with cnbc.com that concerns over the massive US spending during the recession are persisting and will eventually see Gold Prices increase to about $1,200 per ounce.

"When you have such a large part of US population convinced we're running to hell in a handbasket with federal spending, you're going to have a large part of the population buying and taking possession of gold out of fear of what's going on," he told the news provider.

Investors also turn to gold when supplies of the yellow metal are diminishing as this naturally tends to increase demand and therefore push prices higher.

Last week, Harmony Gold, which is the world's fifth-largest gold producer, suspended operations at its Doornkop mine in South Africa after a worker died in an accident involving a conveyor belt.
When incidents of this nature force the closure of mines, production is inevitably impacted.


| Goldbug | goldnews.bullionvault.com | 05-09-2009 |

Tuesday, August 25, 2009

The Precious Metals August 23, 2009

Precious metals like gold and silver appear to be forming a bullish pennant formation, which generally leads to higher prices. Currently the US dollar is hovering around a support level, which is the 76- 79 range. Only time will tell if the US$ breaks down sending gold to new highs in the coming months.

Below is a 4 month spot Gold chart
You can clearly see the pennant formation with gold nearing is apex. Soon enough spot gold prices are going to Blast off or Drop off. I continue to follow the charts closely as we near the apex for a low risk buy signal.
Spot Gold Chart Trading

Below is a 4 month spot Silver chart
Spot silver price is forming a similar price pattern. Because spot silver is much more volatile the pennant is a little taller. Again we wait for a low risk setup.

Precious Metals Trading Conclusion:Spot Silver Chart Trading
Precious metals are slowly working their way to the apex of their large multi month pennant formation. In the coming weeks or months I expect to see prices spike much higher with everyone dumping their money into the safe haven GOLD & SILVER.

OR

When spot silver and gold prices start to break down from these multi month pennants we investors will start withdrawing our funds from precious metals at a very fast rate sending prices down.

As always, I keep focused using my low risk-trading model, which helps to alleviate the emotional part of trading during a time like this. Knowing that my down side risk is generally under 3%, this allows me to stay calm and focused. When a trade goes against me, it is not damaging to my account and I review what I have done to be sure I followed my trading system as planned. Losing trades happens all the time in trading, as it’s just part of the game. Knowing this, accepting it and keeping losses minimal is what separates profitable traders from the not so profitable traders.


| Chris Vermeulen| thegoldandoilguy.com|