LISTENING TO: IKIMfm
IKIMfm
Pilihan Utama Anda

Live Online Trends

Thursday, December 30, 2010

2011 : Gold Forecast To Rise, Buyers Have Multiple Investment Options

Gold is likely to benefit as the U.S. dollar loses purchasing power

The 2011 gold outlook from most analysts, simply put, is higher.

But for new investors wanting to join the gold rush, there is still some homework to do. They might want to familiarize themselves with the many ways in which they can invest--from coins to exchange-traded funds to mining stocks--to decide which are most suited for them.

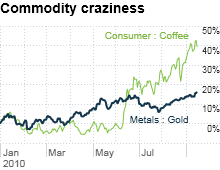
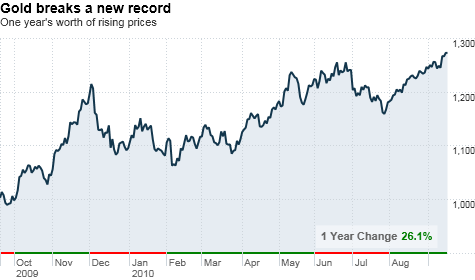
Gold has been in a decade-long bull market, rising from roughly $250 an ounce to a recent record of $1,431. Many look for still more gains. BNP Paribas has forecast an average of $1,500 in 2011, while Goldman Sachs has a 12-month target of $1,690 (but also cautioned that gold could peak in 2012)


2010 Gold Price Review

  • A : January 8th, 2010

    1126.75 - January 8th, 2010 - Precious metals price action turned positive on this day in New York, following weaker dollar values in the wake of dismal employment data. The dollar appeared to be anticipating tomorrow's US payroll figures which are expected to show that the economy has shed jobs during every single month of 2008 and likely pushed unemployment to 7% for a 16-year high. Crude oil fell to under $42 per barrel on apprehensions generated by the employment situation and was only marginally supported by Russia's failure to come to terms with the Ukraine in the gas impasse.

  • B :January 11th, 2010

    1153.00 - January 11th, 2010 - The U.S. economy lost 524,000 jobs in December, closing out the worst year for job losses since World War II, the Labor Department said this date. Nearly 2.6 million jobs were lost in 2008, with 1.9 million destroyed in just the past four months, according to a survey of work places. It's the biggest job loss in any calendar year since 1945. The unemployment rate rose to 7.2%, the highest in 16 years. Unemployment increased by 632,000 to 11.1 million, according to the survey of households.

  • C : May 7th, 2010

    1202.25 - May 7th, 2010 - Gold prices hovered around the $1200 mark early this morning, as their after-hours rise to five-month highs above that round figure on the back of spreading fears about Greek contagion and the Dow's 'air pocket incident' prompted profit-takers to do just that. The U.S. economy added 290,000 jobs in April, the biggest gain in four years. However, the unemployment rate rose slightly, from 9.7% to 9.9%. This is mostly due to people who had previously given up looking for work restarting their job search.

  • D : May 7th, 2010

    1202.25 - May 7th, 2010 - Gold prices hovered around the $1200 mark early this morning, as their after-hours rise to five-month highs above that round figure on the back of spreading fears about Greek contagion and the Dow's 'air pocket incident' prompted profit-takers to do just that. The U.S. economy added 290,000 jobs in April, the biggest gain in four years. However, the unemployment rate rose slightly, from 9.7% to 9.9%. This is mostly due to people who had previously given up looking for work restarting their job search.

  • E : November 4th, 2010

    1381.00 - November 4th, 2010 - As was largely expected the GOP took control of the US House of Representatives and gained Senate seats as well. Gold futures at one point rocketed ahead by nearly $60 an ounce this day compared to their low from the previous afternoon, when the market was initially choppy in the wake of a Federal Open Market Committee announcement of another $600 billion in quantitative easing.

  • F : November 9th, 2010

    1421.00 - November 9th, 2010 - Commodity markets were on fire early this day, led by surging precious metals prices that saw gold futures hit a fresh record high and silver futures hit a fresh 30-year high. Gold's surge in price continued from the mid-term election and QE2 announcement on November 4.

  • G : November 25th, 2010

    1373.25 - November 25th, 2010 - South Korea deployed additional long-range artillery missiles on a border island and vowed to make North Korea “pay the price” for its first direct assault on the country since 1953. Although an armistice has been in place since that time, the two Koreas are still technically at war with each other. A top Chinese emissary met with President Lee on Sunday, after China called for a multilateral emergency meeting aimed at defusing the aggravating crisis.

  • H : December 6th, 2010

    1415.25 - December 6th, 2010 - China and its anti-inflation/anti-bubble combat took centre stage in the market news flows once again on this date, as its People's Bank announced a half percent hike in reserve requirements (to 18%) for the country's banks. The move represented the sixth such tightening this year. Polled analysts believe that inflation may have risen further, possibly to as high a level as 4.6%, and that the PBOC might raise interest rates even as soon as Sunday if it feels that the inflation dragon is growing yet another unwelcome head and getting ready for a menacing flight.

Source : Kitco News

Thursday, November 18, 2010

Gold May Advance to Record After Drop, Barclays Says: Technical Analysis

By Luzi Ann Javier - Nov 18, 2010 4:47 PM GMT+0800

Gold may advance 9.6 percent to a record $1,485 an ounce by the end of the year, according to technical analysts at Barclays Capital.

“Strategically, we are bullish,” the bank said. “Medium- term trend followers are unlikely to have been panicked out of their positions given that important support between $1,314 and $1,331 is still holding,” according to a report dated yesterday by analysts including Philip Roberts.

Gold for immediate delivery gained 1.4 percent to $1,354.95 an ounce today after losing 5.2 percent in the previous four days. The metal climbed to a record $1,424.60 on Nov. 9. Hedge- fund managers and other large speculators increased their net- long positions in New York gold futures by 7 percent in the week ended Nov. 9, ending four weeks of declines, according to U.S. Commodity Futures Trading Commission data.

“A bearish divergence signal on weekly charts, though, warns of downside risk throughout the month, and we still fear an important clearout below $1,314 to $1,250 before gold recovers,” the bank said. “We would be bargain-hunting as the price approaches $1,250.”

Resistance levels are at $1,387, $1,377 and $1,364 an ounce and support is at $1,314, $1,297 and $1,250, it said.

In technical analysis, investors and analysts study charts of trading patterns and prices to predict changes in a security, commodity, currency or index.

Tuesday, September 21, 2010

The Fed's gold problem


By Paul R. La Monica, editor at large


NEW YORK (CNNMoney.com) -- When the Federal Reserve's policy-making committee meets Tuesday, there will be no mystery as to what they will do. Nothing.

But what will the Fed say? That's where things get interesting.

chart_ws_commodity_metals_gold.03(2).png
Click the chart to keep track of other rising commodity prices

In the past few weeks, fears of a double-dip recession have ebbed. August retail sales were better than expected. The number of people filing for unemployment claims has fallen for two weeks in a row.

The trade deficit for July was much narrower than forecasts. That's crucial since a ballooning trade gap in June was the primary reason why the nation's gross domestic product in the second quarter was revised lower.

Still, the economy is not healthy. The latest bits of manufacturing data have been disappointing. The housing market may not have hit bottom yet. Builder Beazer Homes USA (BZH) lowered its forecast for new home orders on Wednesday.

And even with jobless claims falling, companies don't seem to be comfortable enough to start hiring again. Some are still getting rid of workers. FedEx (FDX, Fortune 500) said Thursday it was cutting 1,700 jobs.

For these reasons, the Fed is likely to stress -- as it has since March 2009 -- that it expects to keep interest rates "exceptionally low" for "an extended period of time." (Rates have been near 0% since December 2008.)

It may also talk more about its commitment to purchase long-term bonds as it sees fit. In its last meeting, the Fed said it would reinvest the principal from mortgage-backed securities it holds into long-term Treasurys.

But it stopped short of announcing a new plan to buy bonds, a practice known as quantitative easing.

David Joy, chief market strategist with Columbia Management in Boston, said the economy doesn't appear to be so weak that the Fed should step up its bond buying yet. But it can't afford to be complacent either.

"The message we are left with from all the recent data is that this is a sluggish recovery," Joy said. "The Fed may feel a little better about the economy since they last met in August -- but not much."

But if the economy takes a sudden turn for the worse again -- Jon Stewart recently joked that "the 'Summer of Recovery' is quickly sliding into the 'Autumn of Nothing but Ramen Noodles For Dinner,' " -- then the Fed will have to give specifics about its plans to buy more bonds.

"The Fed may have to be aggressive," said Anthony Valeri, market strategist with LPL Financial in San Diego. "What people are looking for is a dollar amount. It could be $500 billion to $1 trillion."

Valeri doubted the Fed would make such an announcement on Tuesday but said it was possible it would unveil more concrete plans at its November 3 meeting.

Still, some think the Fed may have to think more about pulling back on its easy money policies. That's because there are still niggling worries about inflation.

Yes, inflation.

Deflation may be the big buzz word as economists fret about whether the United States is heading for its own version of Japan's Lost Decade during the 1990's.

But have you looked at what commodity prices are doing? The Fed may soon need to start worrying about that dreaded 1970's throwback of stagflation: the combination of anemic growth and rising prices.

Gold is hitting record highs. Agricultural commodities are soaring and in some cases, such as bacon and coffee, producers are passing higher costs onto consumers. And the dollar has been on a downward slide against the yen and euro.

While it would be foolish to suggest that the spike in commodities is entirely the Fed's fault, it is fair to say the central bank's more pessimistic take on the economy sparked worries that the Fed will be too slow to react to pricing pressures.

"The Fed may have jumped the gun last time and created the fear that things are worse then they actually believed," said Milton Ezrati, senior economist with Lord Abbett, an investment firm in Jersey City, N.J.

Ezrati said the increase in commodity prices is evidence that deflation and double-dip talk may be overblown. Along those lines, the latest figures on inflation on a wholesale level, the producer price index, rose more than expected in August. Consumer prices also were up a bit more than forecasts in August.

And even though the so-called core PPI number, which excludes food and energy costs, was in line with forecasts, the myopic focus on that number is sometimes silly.

People have to eat and drive. If fuel and food costs keep going up, try telling consumers they need to worry about deflation.

"You would think the Fed should mention the risk that commodity prices could go higher," said Andrew Busch, global currency and public policy strategist with BMO Capital Markets in Chicago. "The Fed needs to discuss the potential for inflation for the long term."

- The opinions expressed in this commentary are solely those of Paul R. La Monica. Other than Time Warner, the parent of CNNMoney.com, and Abbott Laboratories, La Monica does not own positions in any individual stocks. To top of page

Monday, September 20, 2010

Gold edges up to a new record

chart_ws_commodity_metals_gold.top.png
Click chart for more commodities prices.
By Aaron Smith, staff writer

NEW YORK (CNNMoney.com) -- Gold continues to break records, hitting its fourth new high in a week Monday, fueled by economic jitters.

Gold futures for December delivery closed at $1,280.80 an ounce, up $3.30, or about 0.3%. That breaks the record close that was set on Sept. 17, when prices rose $3.70 to settle at $1,277.50 an ounce.

Gold futures for December delivery reached an intraday record that was even higher, at $1,285.20 per ounce. The prior intraday record was $1,284.40 an ounce, on Sept. 17.

Gold prices have been riding a wave of economic uncertainty. Jono Remington-Hobbs, a precious metals analyst for the TheBullionDesk in London, said the big drivers are economic uncertainty, volatility in the currency markets and the possibility of more quantitative easing -- meaning the buying of bonds by the U.S. government.

Despite the announcement by the National Bureau of Economic Research that the recession ended in June 2009, Remington-Hobbs said he believes that uncertainty will continue to drive gold prices.

"I think there's a strong chance that gold will get close to touching $1,300 [per ounce] in the next month or two, actually," he said.

Gold prices have climbed 26% over the last 12 months. But in actuality, prices are a far cry from their true record, when adjusted for inflation.

Gold hit its true peak on Jan. 21, 1980, when it rose to $825.50 an ounce. Adjusted for inflation, that translates to an all-time record of $2,184.08 an ounce, in 2010 dollars. To top of page

Saturday, February 6, 2010

Gold hits 3-month low on economic uncertainties

Frank Tang and Jan Harvey
Fri Feb 5, 2010 3:17pm EST

An employee takes gold ingots to be weighed in a room for final weighing and packaging at the Krastsvetmet plant in the Siberian city of Krasnoyarsk November 16, 2009.

Credit: Reuters/Ilya Naymushin

NEW YORK/LONDON (Reuters) - Gold fell to its lowest in more than three months on Friday, ending the week 2 percent lower, as economic uncertainties led to heavy selling in gold and other investments perceived as riskier.

Bullion dropped further after posting its biggest one-day loss since 2008 on Thursday, hit by sovereign debt fears in Europe, and signs that economic recovery in United States and China has hit a rough patch.

On charts, gold is vulnerable to extending sharp losses to reach $1,020-1,030 an ounce if support at current levels fails to hold, and may face a deeper retracement below $1,000 if it breaks that level, technical analysts said.

The metal, however, could see support in the near term as investors bid up COMEX gold call options and gold miners' stock prices, floor traders and fund managers said.

"Investors are looking to some large-cap gold stocks as a way to hedge currency unrest and potential debt default in Europe," said Brian Hicks, co-manager of Global Resources Fund at U.S. Global Investors, which has over $2 billion in mutual fund assets.

Shares of the world's largest gold producer Barrick Gold (ABX.TO) and No. 2 Newmont Mining (NEM.N) are about 4 percent higher despite weaker gold prices and broad-based equities weakness.

Spot gold fell to a low of $1,043.75, and was last at $1,062.25 an ounce at 2:38 p.m. EST, against $1,062.60 late in New York on Thursday.

Spot bullion is about 2 percent lower from last Friday's close at $1,081.05 an ounce.

U.S. gold futures for April delivery on the COMEX division of the New York Mercantile Exchange settled down $10.20 at $1,052.80 an ounce.

Gold is extending losses after prices fell 4 percent on Thursday after European Central Bank chief Jean-Claude Trichet predicted rising fiscal imbalances over the euro zone economy, and that knocked the euro.

The euro fell to its lowest level against the dollar since May on rising risk aversion, as the cost of insuring the debt of some euro zone nations against default hit record highs on worries over their fiscal positions.

CRUDE PLUNGES, ETF REPORTS OUTFLOWS

Oil prices briefly tumbled below $70 a barrel, as the stronger dollar and data showing additional U.S. job cuts weighed on the market.

Earlier on Friday, U.S. data showed that nonfarm payrolls fell unexpectedly in January, but unemployment rate surprisingly dropped to a five-month low.

"Gold is going to show higher volatility until there is more of a trend established in U.S. economic recovery," said Thomas Winmill, portfolio manager of Midas Fund. MIDSX.O

Investment in gold-backed exchange-traded funds was lackluster, with holdings of the world's biggest, New York's SPDR Gold Trust falling 5.8 tonnes or 0.5 percent on Thursday.

Silver also tumbled to its lowest since early September at $14.63, tracking losses in gold. It was later at $14.91 an ounce versus $15.23.

Platinum and palladium also hit 2010 lows at $1,444 an ounce and $379.50 an ounce respectively. Platinum was later at $1,471 an ounce versus $1,499.50, while palladium was at $394.50 against $406.50.

(Reporting by Frank Tang and Jan Harvey; Editing by Marguerita Choy)

Pivot Point Trading 101

By Jeff Friedman

Pivot-trading has been around a long time, and is a favorite technical analysis tool for many professional traders. Learning how to use pivot points helps take the emotion out of trading, and gives you discipline. Pivots are useful in not only helping you to determine price direction, but also as a money management tool. You can apply the concepts to virtually any market, but I think the pivot methodology works particularly well in stock indexes, particularly the S&P and E-mini S&P 500 index futures.

The E-mini S&P is priced right for smaller investors, the volume is superb, and fills are nearly instantaneous. And, CME Group’s Globex platform offers trading nearly around the clock. So I’m going to use this market in my examples of how to apply the pivot methodology to real market conditions. But first, some background to understand what pivots are, and how they can be used as part of technical analysis.

Pure market technicians believe all the factors related to supply and demand are reflected in a market’s price, and therefore they don’t concern themselves with fundamental analysis. Technical analysis is the study of price and price behavior using charts and various other tools to help determine market trends, and to predict where prices could be headed next.

Chart patterns can be ambiguous and subject to interpretation, but pivots are not. They are defined price points. They tell me that when the market moves above a determined number I should be bullish, and when it moves below another determined number I should be bearish. And, if I’m already long (or short) because the market moved above (or below) one of my pivots, they can help me determine where to place my stops and exit my trades. Pivots also take volatility into account to show momentum.


Calculating Pivots

The traditional formula for calculating pivot points incorporates three data points: the previous day’s high, low and close. You can use other datasets and/or time frames to find what gives you a unique edge. Some traders like to use the open in their calculation. I like to calculate both weekly and daily pivot numbers, which can be used for swing trading or day trading. No matter which numbers you use, the value of using pivots is to tell you whether the market is pivoting to a higher-level value, or to a lower-level value. Pivot points also take volatility into account to show momentum. Do they always work perfectly? No. But will they give you guidance? Absolutely.

To calculate basic daily pivot points, you will add the high, low and close of the previous trading day, and divide by three. You want to do this before the market opens for the session you wish to trade, so you will have your levels and be ready. The first support (S1) is two times the pivot minus the high, while first resistance is two times the pivot minus the low. To find second support, take the difference between the high and low, then subtract that number from the pivot. Second resistance is the difference between the high and the low, added to the pivot.

Pivot Point = (H + L + C) / 3
1st Support = (2 x Pivot) - H
1st Resistance = (2 x Pivot) - L
2nd Support = Pivot – (H – L)
2nd Resistance= Pivot + (H – L)

As mentioned, there are also other variations of this basic analysis. Some traders will incorporate the opening of the next day, adding to the high, low and close of the prior day, and then dividing by four. Some traders believe the opening is more important than the prior day’s close, so they use the high and low of the prior day, and the new opening the next day divided by three. These traders probably wouldn’t trade during the first few minutes of the session as they calculate their pivots based on the current day’s open.

You might be asking yourself, which session do you I use in my calculations? Do you use the overnight session, or day session, or both combined? It’s really up to you to find a method that might give you an edge. I prefer the classic calculation using the regular day session, and use the opening range (roughly first hour of trade) as a separate pivot point by itself, as a breakout level.

Support and Resistance
There are two ways of using pivots. The core technique is based on support and resistance. We can use other technical indicators, such as moving averages, to support this analysis and help provide confirmation. The idea is to sell when prices violate support levels in a break and buy when prices push through resistance on the upside.

Support and resistance are key points to watch in chart patterns. Support occurs when increased demand for a particular futures market builds a floor under that market’s price. A support level or zone appears when buyers miss purchasing a futures contract and vow to buy it later should prices decline to the same, or nearly the same, level. Resistance occurs when selling pressure stops a market’s price rise. A resistance level is similar to a support level in that traders who buy the futures con¬tract just before it tumbles vow to sell if its price rallies back to their purchase price. In bull markets, old resistance often becomes future support and in bear markets, old support becomes new resistance.

Finding first and second resistance (R1 and R2) and first and second support (S1 and S2) can help you predict how far prices might climb and how far they might fall. These levels can also provide key stop-loss levels, a vital risk-management tool.

Look at support and resistance as floors and ceilings of a building. If you can break through the floor of the second story, you’ll fall through the ceiling of the first story, and probably land on the floor, now one story lower. Resistance numbers are always higher than your pivot, and your pivot is always higher than your support numbers. You can use these numbers without ever even looking at a chart.

Trading the Pivot
Pivot points can also be considered critical junctures in markets. If the market is flip-flopping around a pivot number, the market is trying to decide if that pivot is valid, and to what extent. The fact that so many traders watch these pivot numbers means they can be a self-fulfilling prophesy. If everyone believes some certain number is support, and the market starts to rise, they will think, “I need to buy.”

More day traders use pivot trading than swing traders, but the approach can be used successfully for either trading time horizon. If daily and weekly pivot numbers line up, they have an even stronger impact. You could even take the last three daily or weekly pivots and divide by three to get an average pivot.

Let’s take a look at how we calculate and use pivots to trade the E-mini S&P. First, let’s consider the weekly pivots for the week of February 1 – 2, 2010. We are using data from the prior trading week to calculate our pivot, support and resistance points as follows.

S&P 500 Weekly Pivots, February 1 - 5
High 1,103.30 Low 1,066.70 Close 1,070.40
R1 = 1,093.57 R2 = 1,116.73
Weekly Pivot = 1,080.13
S1 = 1,056.97 S2 = 1,043.53

If the market moved under my weekly pivot that would be bearish, and if the market moved above it, that would be bullish on a weekly basis. Even if the market falls under our pivot at 1,080, if you are a longer-term trader you might want to wait to sell until if falls under our S1 of 1,056. Short-term traders who got long at 1,082 on Monday would’ve caught a nice move higher that day, which was extended with another bullish session on Tuesday.

friedman-pivot-weekly-2-5-10

S&P 500 Daily Pivots, February 1
High 1,093 Low 1,066.70 Close 1,070.40
R1 = 1,086.70 R2 = 1,103.00
Daily Pivot 1,076.70
S1 = 1,060.40 S2 = 1,050.40

When the market rallied above our pivot on February 1, you would have considered buying. S1 The high on Monday was 1,086, close to our R1 at 1,086.70, and also where the market closed. That would be a good place to consider taking profits.

friedman-pivot-daily-2-5-10

Playing the pivots can help you uncover opportunities, but this technique will not always work perfectly every day or week. However, pivots can be effective money management tools in volatile sessions, as you use your support and resistance points as levels to get you out of the market as need be, before heavier losses mount. Remember, you don’t have to be right 100 percent of the time to be a successful trader. Use your pivots to employ proper money management, and to find trades with attractive risk-reward profiles. Never risk more than you can afford to lose, or hope to make!

I welcome you to give me a call to discuss this technique in further detail, or to answer any other questions you have about the markets.

Jeff Friedman is a Senior Market Strategist with Lind Plus. He can be reached at 866-231-7811 or via email at jfriedman@lind-waldock.com. You can follow Jeff on Twitter at www.twitter.com/LWJFriedman. Join Jeff for his monthly webinar, Friedman’s Futures Forecast, by visiting Lind-Waldock’s events page. You can view an archived webinar of this forecast at www.lind-waldock.com/events, where Jeff covers even more detail.

---------------

Paksu : Here are resistance, pivot dan support on 5 Feb 2010 from Hafeez Blog

Resistance 3: 1130.80
Resistance 2: 1111.05
Resistance 1: 1098.85

Pivot : 1079.00

Support 1: 1059.35
Support 2: 1047.15
Support 3: 1027.45

Silver in the Spotlight

by Dennis Cajigas

Gold has been in the spotlight, but silver has been a hidden bull, and I expect it to rally for several reasons. Traders who are leery of buying gold at record-high prices might consider a silver play.

Dollar Weakness

Silver should find strength from expected continued weakness in the U.S. dollar. Commodities saw a broad-based rally on Monday, November 9, after the weekend G-20 meeting, where finance ministers agreed to continue global economic stimulus measures. The dollar weakened after the meeting and many commodities surged, including grains, energies and metals, as well as the stock market. The U.S. Federal Reserve left monetary policy unchanged at last week’s policy meeting, and rates look to remain near zero for some time. Therefore, I don’t see the dollar’s trend changing much anytime soon either.

There has been a fairly strong inverse relationship between the U.S. dollar and commodities. U.S. dollar-denominated commodities have been strengthening, as a cheaper U.S. dollar means cheaper prices for countries looking to import goods.

We have also been hearing rumblings of central banks trying to diversify away from the U.S. dollar and buying gold, and also perhaps a currency basket. While that trend could take some time on a large scale to occur, it would likely exacerbate dollar weakness, and silver and gold should both benefit.

Silver should follow rallies in other precious metals, including platinum and palladium, as these metals also benefit from increased industrial demand, both real and anticipated, as we exit of the recession.

Funds Net Long

Looking at the latest weekly data in the Commodity Futures Trading Commission’s Commitments of Traders report, fund buying and non-reportable (small speculators) were net long about a combined 64,800 silver contracts. Even though there is weakness in the economy (notably the employment situation) there is fund interest in commodities. Investors are interested in hard assets. Several funds have also been looking to rebalance some of their portfolios in compliance with CFTC regulationsI expect to see broader and deeper positions, perhaps moving out of gold and into other metals such as silver, which should benefit from this process.

Gold has hit a new record-high above $1,100 an ounce, but silver has been lagging. I expect silver may play some catch-up over the next few weeks or months, and should post even greater gains on a percentage basis than gold. Silver has not able to break through last month’s high, but I believe that should happen fairly soon.

Metal Ratios

Anticipated inflation should also prove a driver for metals prices in general, as a hedge. The monetary and non-monetary metal ratios (between silver and gold) are important to note. The historical peg for the monetary ratio of these metals is about 15-to-1. That means about 15 ½ ounces in silver is typically required to buy an ounce of gold. Currently, this ratio is at 63-to-1, or 63 ounces of silver are required to buy an ounce of gold. If this relationship reverts to historical norms, silver should rally significantly higher to catch up.

The non-monetary metal ratio on COMEX silver to gold contracts is 7-to-1. That means 7 contracts in silver are required to equal one gold contract. That effectively means that if gold moves to $1,200 (a move of $100), we should see silver at least $2 an ounce higher, with an objective of $19 in the medium-term.

Trading Silver with Moving Averages

The daily chart of the March COMEX silver contract shows the 50-day moving average in blue. We can see how the market has bounced off these supports. The 200-day moving average is in green. This chart shows an increase between the 50- and 200-day moving averages. There is an increase in the distance between these moving averages, indicating an increase in momentum, and in new buying coming in. The 50-day moving average is reacting and increasing its slope more so than the 200-day moving average. The differential suggests increasing strength and increasing buying. We haven’t broken resistance at $18, but if this trend continues, I expect a breakout in the next few days. The 50-day moving average, near $16.92, is holding as support and looks like a great place to establish a long position.

cajigas_silver_1_11-10-09Looking at a weekly chart, we can see the uptrend extending from 2008. The 50-day moving average is showing strong buying coming in, and the 200-week average shows a smoother line. Similar strong support is seen near $17 on the weekly chart also. A $2 move in silver would give a target of $19.50, also a strong resistance level. If gold really does take off, I would expect even higher prices ahead for silver.

cajigas_silver2_11-10-09Please contact me to develop a customized strategy to fit your unique situation. I’d be happy to take your questions about this or other markets.

Dennis Cajigas is a Senior Market Strategist with Lind Plus, Lind-Waldock’s broker-assisted division. He can be reached at 866-631-6216 or via email at dcajigas@lind-waldock.com
-----------------
Paksu: Public Gold also sell silver kilo bar, be the first silver order. Call me.

Introduction to MACD

by Dennis Cajigas

Moving Average Convergence/Divergence, otherwise known as MACD, was created by Gerald Appel in the 1960s as a way to analyze market momentum and strength. While it fell out of favor in the early 1980s, it experienced a resurgence of popularity with the development of the MACD histogram by Thomas Aspey in 1986. The histogram provided a way to anticipate crossovers in the MACD, providing another method of analysis that gave the MACD a renewed sense of relevance. Traders often use the histogram as a tool to anticipate trend and momentum shifts.

One of the most useful things about the MACD is that it allows traders the ability to identify market trend changes and strength of momentum in a single indicator. It is particularly popular among currency traders.

The MACD represents the difference between two (fast and slow) weighted moving averages of closing prices. The 12-day moving average is commonly used to represent the fast, while the 26-day moving average, the slow. A trigger line, or signal line, is created by smoothing the result with another weighted moving average. Most commonly, the 9-day is used. This creates a centered momentum oscillator, which visually indicates shifts in trend or changes in momentum.

Common Pitfalls
The MACD is a powerful and useful indicator, but it is a lagging indicator. Often there may be a delay between a signal in the MACD and price movement. The MACD may be used in all market condition types, but it is most useful in volatile markets when trend changes more frequently.

Traders should be careful not to mix signals when forming their trade strategies. For example, when entering a momentum-based trade, the exit strategy should be on a momentum indicator rather than a price, time or profit target.

Four Types of Signals

1. Moving Average Crossover. This occurs when the two moving averages (fast and slow) cross. It indicates a potential shift in trend; essentially more buying (or selling) is coming into the market. It is the most common type of signal, but should be reinforced with another type of signal as it can occur fairly often. A three-bar confirmation in the price action or in the MACD histogram can provide a confirmation signal.

In the chart examples that follow, you’ll see two red and blue lines at the bottom, representing the two moving average time periods (fast and slow). The histogram in the middle has a line running through the center, which creates a trigger or signal line.

The histogram visually shows the difference between the moving averages. It also smoothes out fluctuations. I’m using a candlestick chart, with down days designated by red candles and up days by green.

Let’s look at a daily chart of the U.S. dollar in 2009 as an example. In the lower part of the screen, there is a moving average crossover of the12-day and 26-day moving averages, represented by the tan circle. We see the shift in price reflected in the corresponding tan circle in the candlestick chart, as the market starts to decline. There is another crossover as the trend shifts to the positive side in the next set of light blue circles farther to the right of the chart, as buying comes into the market. You see the reflection of the price move in the MACD, and we have continued rallies going forward.

Chart 1, Moving Average Crossover

macd-1

2. Centerline Crossover. This occurs when the MACD moves past the zero line and moves into the opposite territory. That is, going from positive to negative, or negative to positive. It can be combined with other types of indicators to confirm the signal. Traders will often also monitor the slope of the histogram or the two indicator lines to reveal increasing strength or weakness of the market momentum. How quickly is it moving, and how fast and strong?

In the next chart, we see the centerline crossover and the shift from negative to positive. The bars are steadily and slowly increasing, which shows more buying coming in, and increased positive momentum (represented by the beige ellipses). Notice the extreme slope on the histogram and the corresponding gaps in price action on the chart. A bit of a bullish pennant formation is seen in the price chart.

The purple bars (histograms) move below the zero line and then above as price rises (tan circles). We then see a negative crossover to the right on the chart. As the length of the histogram increases, the slope increases and we see that in bearish price action (indicated by the light blue circles).

macd-picture2

3. Positive/Negative Divergence. This occurs when the strength or weakness of the MACD differs from the relative price action of the market. It is the least common of all the MACD signals, but is often the most reliable of the MACD signals, indicating a major trend shift.

On Chart 3, we see a high occur, and then a lower high on the MACD histogram, indicating weakening or exhausting buying pressure. The MACD is telling us the rally we are seeing is a weak one (see the orange line at top right). Afterward, we see a drop in price reinforced by the drop in the MACD and MACD histogram. The market’s bottom should be indicated by a drop in momentum.

Chart 3, Positive/Negative Divergence

macd3

4. Multiple Indicator Signal. If you have one indicator producing a signal, you might want to reinforce it. As the MACD crossover goes from bearish to bullish in Chart 4, it is reinforced later by a centerline crossover. We thus have two signals combining to reinforce the trade. We see an increasing histogram, indicating increasing bullish momentum entering into the market, and price action confirms the bullish shift. Within the light blue ellipses, we see multiple indicators. The MACD crossover gives indications of a possible shift, and the centerline crossover indicates increasing momentum.

Chart 4, Multiple Indicator Signal

macd-4

Looking at a more current chart of the U.S. dollar in early 2010, the blue ellipse represents a positive (bullish) moving average crossover and it is reinforced by a positive centerline crossover. These bullish MACD signals are reflecting the shift in price action and you can see market trend change indicated by the blue ellipse on the price chart.

The beige rectangle is overlain on another positive moving average crossover and the MACD signaled a momentum shift within an already established trend. The MACD signal indicated a rally extension (micro-trend change) as opposed to a major trend shift.

U.S. Dollar Index, Early 2010

macd5-dennis2

This is just a brief introduction to MACD, and I encourage you to do further research and to contact me with questions on how you might apply these techniques to your market analysis. I find the MACD to be useful for all markets to determine momentum and trend shifts.

Dennis G. Cajigas is a Senior Market Strategist with Lind Plus, Lind-Waldock’s broker-assisted division. He can be reached at (866) 631-6216 or by email at dcajigas@lind-waldock.com.

----------------

Paksu : A lot of thing we should learn but this is the best tool for me to monitor gold price.