

Sometimes, review is a good
thing. Thus, I pulled this from my vast archives of writing because it
speaks to a volatile market (it pertains to equity as well as forex
trading), much like the one we now are in, again …
Another week in the market is now under our belt. Although, I can’t complain, as things have
been going my way, I can say that I hope the economy stabilizes sooner
rather than later, which I guess puts me in the company of, oh, just
about everyone else in America. Be that as it may, I do have the
question below to answer, and so I will …
I am new in forex the field. I learned that if RSI is above 70 than I should sell, and if it is below 30 than I should buy. Mostly, though, the RSI seem to remain in the 40, 50, 60 range most of the time. What should I do at these points?
The
first thing I will tell you is that one indicator does not a trade
make. If you are relying just on RSI (Relative Strength Index), then
you are making a mistake.
Generally, indicators work in combination
with other indicators to both find and confirm potential trades. Thus,
the RSI only has meaningful value when compared with other indicators,
if you ask me, and you did.
Second,
even if you rely solely on the RSI, or if you do use it in combination
with other indicators, the 70/30, buy/sell “rule” is not a rule at all;
it is a guide.
Generally, when in the 70 range, a market is considered
“overbought.” When in the 30 range, a market is considered “oversold.”
But even though the readings may be such, you should consider other
factors in the RSI, such as the timing of the move into either the 70 or
30 range, how long the indicator has remained within either range, and
the general volatility of the market itself during the trading time you
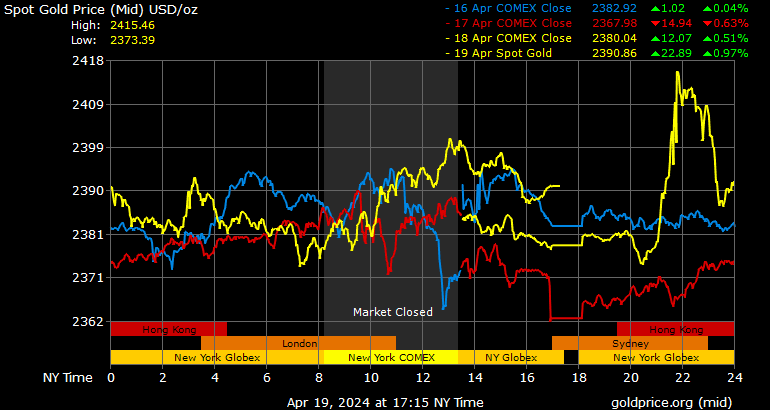
are viewing. Outside of the RSI, in my opinion, two of the best
indicators to use in combination with the RSI are MACD (Moving Average
Convergence Divergence) and Stochastic. Both indicators give
information on momentum, which allows you to compare with what the RSI
is telling you (See the chart below.).

Note
how all three indicators are telling almost the same story – the market
has enjoyed certain stability and a bit of an upturn. The RSI,
however, suggests that that the “run” may be over. The other
indicators, although not as definite as the RSI, suggest the same.
As
to the notion that in forex, the RSI seems to be in the middles ranges
most of the time, I really don’t have much to say to that, other than
you just might need to spend a lot more time watching the charts. Where
the RSI goes is wholly dependent on the price action of the market, and
in these days of high volatility, I would think the forex markets would
spend at least as much time in the 70/30 range as they spend in the
middle range. As to what you should do when the RSI is in the middle
range … Well, I guess that just depends on your strategy. You do have a
strategy, right?
Trade in the day; invest in your life …
Trader Ed 


No comments:
Post a Comment